How many people who visit your website go on to buy tickets? Your online conversion rate can help answer that question. It gives live event organizations a way to understand how effectively their digital purchase journey turns interest into sales.
The number becomes more useful when you have something meaningful to compare it with. A benchmark can help you spot a change in performance, set a realistic goal, and decide where to look more closely. But one industry-wide figure cannot tell the whole story for a theater, museum, festival, and sports venue alike.
Here is how to calculate your rate, choose useful comparisons, and turn what you learn into a better buying experience.
What is an online ticket conversion rate?
Online ticket conversion rate is the percentage of website sessions that result in a ticket purchase. To calculate it, divide the number of sessions with a completed ticket purchase by the total number of website sessions, then multiply by 100.
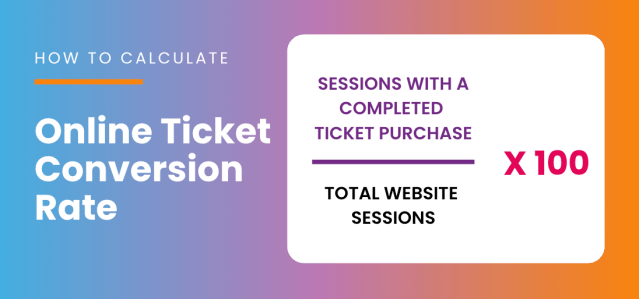
For example, if your website has 200 sessions and 20 of those sessions include a ticket purchase, your conversion rate is 10%. This is an illustrative example, not an industry benchmark.
Before comparing results, make sure your team uses the same definition and measurement period each time. If your analytics reports count transactions rather than sessions with a purchase, label the metric accordingly; a session can contain more than one transaction.
What is a good conversion rate for live events?
There is no single target that applies to every event organization. The type of event, how people find it, when tickets go on sale, and the steps required to complete a purchase can all influence conversion.
A visitor following a direct link to an event they already want to attend may behave differently from someone browsing a full season for the first time. A purchase that involves choosing seats, a dining time, or a package may also require more decisions than a general admission ticket.
That is why an industry benchmark is a starting point for questions, not a score you need to beat. The most useful comparisons put your rate in context:
- Your own performance over time: Compare similar on-sale periods, event types, and marketing campaigns to see whether conversion is improving or declining.
- Comparable events or organizations: Where reliable peer data is available, look for organizations with similar offerings and purchase journeys rather than relying on one figure for the entire industry.
- Different steps in your purchase journey: Look beyond the final rate to see whether visitors leave on the event page, during seat selection, in the cart, or at checkout.
If you use an external benchmark, check when the data was collected, which organizations it includes, and how conversion was calculated. Those details determine whether the comparison is useful for your organization.
How to use benchmarks to find opportunities
Start with a baseline from your own website and track it consistently. Then break it down by event type, device, traffic source, or on-sale period where you have enough data to make a meaningful comparison.
If your overall rate falls, the next question is where and for whom. Are mobile visitors leaving during checkout? Are people reaching an event page but not starting a purchase? Do buyers abandon their carts after seeing the full order total? Each pattern points to a different opportunity.
Consider other measures alongside conversion rate, too. Average order value and total ticket revenue can help you understand the full picture. An optional donation or merchandise offer might add a decision to checkout while increasing the value of completed orders. A higher conversion rate on its own does not always mean a better outcome for your organization.
Ways to improve online ticket conversion
Recent event ticketing usability research from Baymard Institute found that buyers struggled when prices, fees, ticket availability, or seat details were hard to assess early in the journey. These are useful places to investigate when visitors reach your ticketing pages but do not complete a purchase.
Once you know where buyers encounter friction, prioritize changes to that part of the journey. Depending on what your data shows, you could:
- Make event information easy to find. Put dates, times, locations, ticket options, and accessibility details where buyers need them to make a decision.
- Show the full cost clearly. Give buyers a clear view of prices and fees before the final checkout step so the total does not come as a surprise.
- Simplify seat and ticket selection. Make it easy to understand available options and move forward without unnecessary steps.
- Check the mobile experience. Test how event discovery, ticket selection, forms, and payment work on a phone, where small points of friction can be especially noticeable.
- Make checkout progress clear. Show buyers what remains, offer appropriate payment and delivery options, and remove fields that do not serve a clear purpose.
- Follow up when a purchase is left unfinished. Where you have the necessary permissions and contact details, a timely cart reminder can give interested buyers a way back to their order.
Choose a change that addresses a problem you can see, then measure its effect. That will tell you more than applying a long list of checkout tips at once.
Turn your benchmark into a better buying experience
Online conversion rate helps you see how many website visits become ticket purchases. Benchmarks give that number context; a closer look at your own buyer journey tells you what to do next.
Start with a consistent baseline, compare similar experiences, and investigate where potential buyers leave. From there, you can make changes that help more people complete a purchase while supporting your wider revenue goals.
Want to see how AudienceView Professional supports the ticket buying journey? Explore the product tour.